NC Financial Literacy Scorecard 2026
Digital Scorecard
| State Agency Representative | State Agency |
|---|---|
| James P. Morton | Community College System |
| Heather B. Horton * | NC Department of Commerce |
| A. Mercedes Restucha * | NC Department of Justice |
| Kent Woodson * | NC Department of Labor |
| Dr. Lori M. Carlin | NC Department of Public Instruction |
| Javier Carlos | NC Department of Revenue |
| Christy Farrelly | NC Department of State Treasurer |
| Sidney Thomas | NC Office of the Commissioner of Banks |
| John Maron * | NC Office of the Secretary of State |
| Dr. Srini Krishnamurthy * | UNC School System |
| * indicates members of the Scorecard sub-committee. |
| Member of the Public | Representation |
|---|---|
| Louise Mack | Consumer Advocacy or Nonprofit Financial Education |
| Stuart L. Mills, Chair * | Consumer Advocacy or Nonprofit Financial Education |
| Kokou Nayo | Consumer Advocacy or Nonprofit Financial Education |
| Tamara Quick Stanley | Consumer Advocacy or Nonprofit Financial Education |
| Muye Akinkuotu | Financial Services Industry |
| Ebonee J. Streater | Financial Services Industry |
| Artie Nicholson Collins | Employers Providing Financial Education |
| Keith A. Epstein | Employers Providing Financial Education |
| * indicates members of the Scorecard sub-committee. |
We would like to thank the FINRA Investor Education Foundation for providing the data used in this report. We are especially grateful to Jonathan Hudson, Dr. Olivia Valdes, and Gerri Walsh for their assistance.
We also thank Archita Srinivasan, a senior at Green Level High School, for her help with research at multiple stages of the project.
The North Carolina Financial Literacy Council (FLC) is proud to present its first Financial Literacy Scorecard for the State of North Carolina. This scorecard provides a snapshot of residents’ financial knowledge and preparedness across the state today. It is designed to be a helpful resource for state and local governments, schools and colleges, nonprofit organizations focused on financial education, and financial institutions. By understanding North Carolina’s current state of financial literacy among adults, these groups can better support residents in developing strong financial knowledge and skills.
In producing this scorecard, the FLC analyzed anonymized data collected at three-year intervals between 2015-2024 by the FINRA Foundation as part of its ongoing National Financial Capability Study2. The FLC compared responses from North Carolina residents to those from neighboring states (Georgia, South Carolina, Tennessee and Virginia) as well as from the country as a whole.
Financial literacy - the ability to understand and effectively use financial information - plays an important role in everyday life. From budgeting and saving to borrowing and investing, financial knowledge helps people make informed decisions about their money. These decisions can enhance financial stability, strengthen financial resilience, and enable households to better manage unexpected challenges. Financial stress not only strains household budgets - it can also affect overall wellness.3,4 By helping people make better financial decisions and reducing financial stress, stronger financial education improves mental health and reduces broader social and economic costs.5
Despite widespread confidence in managing their finances, most Americans struggle with fundamental financial concepts. A lack of financial knowledge can lead people to make poor decisions (e.g., taking on excessive debt or failing to save adequately for retirement), which jeopardizes personal well-being, household stability, and the broader economy. Improving financial literacy can therefore strengthen individual financial well-being, reduce financial stress, build resilience, and contribute to healthier communities.
The first step in this process is understanding where things currently stand. This scorecard provides a starting point by offering a clear picture of North Carolina’s current level of adult financial literacy.
[2] “The National Financial Capability Study,” FINRA Investor Education Foundation, 2024.https://finrafoundation.org/national-financial-capability-study.
[3] “Financial stress and depression in adults: A systematic review”, N. Guan et al., PLOS One, 2022. https://doi.org/10.1371/journal.pone.0264041
[4] “The role of financial stress in mental health changes during COVID-19”, O. Simonse et al., npj Mental Health Research, 2022. https://www.nature.com/articles/s44184-022-00016-5
[5] One global study that was presented at the World Economic Forum estimated that between 2010 and 2030, mental health conditions would lead to an economic loss of approximately $16 trillion worldwide due to reduced productivity and other impacts. “The global economic burden of noncommunicable diseases”, D. E. Bloom et al., 2011. https://www3.weforum.org/docs/WEF_Harvard_HE_GlobalEconomicBurdenNonCommunicableDiseases_2011.pdf
Several important patterns emerge from the data.
- Overall financial literacy remains relatively low. Nationally, only 27% of respondents answered at least two-thirds of the FINRA Foundation’s financial literacy questions correctly, while 34% answered fewer than one-third correctly.
- The results for neighboring states are similar, but North Carolina lags the national average on several measures. Fewer North Carolina residents (3-6% fewer) answered questions correctly than the national average.
- Many people overestimate their financial knowledge. While only 27% of US respondents demonstrate high financial literacy, 40% rate their own financial knowledge as high.
- A gender gap persists, with the differences as high as 18% on some questions. Women score lower than men on the seven financial literacy questions and report lower confidence in managing their finances. Trends from 2015 to 2024 suggest persistent differences between men and women. Women also report having poorer access to financial literacy programs.
- Respondents who participated in financial education programs performed better on financial literacy questions and reported greater confidence in handling financial decisions. Financial education participation in North Carolina is associated with a 13-percentage-point increase in high financial literacy.
Overall, financial literacy in the United States remains relatively low, with many respondents struggling to answer FINRA Foundation’s seven questions about key financial concepts.
Most respondents correctly answered three financial literacy questions which relate to mortgage duration and interest payments (74%), interest rates (74%), and inflation (59%). These topics are common in everyday financial discussions, so the relatively low proportions of incorrect responses (less than 20%) and “don’t know” responses (less than 22%) are not surprising.
A minority of respondents correctly answered questions based on savings and investing concepts. These questions related to diversification and risk (45% correct responses), compound interest (31%), the relationship between interest rates and bond prices (27%), and probability (37%).7
Financial literacy (2015-2024, N = 107,312)
| Topic | Correct | Incorrect | No Response |
|---|---|---|---|
| Mortgage duration and interest | 74.2% | 7.7% | 18.2% |
| Interest rates | 73.5% | 12.7% | 13.8% |
| Inflation and purchasing power | 58.9% | 19.5% | 21.6% |
| Diversification and risk | 45.2% | 10.0% | 44.8% |
| Compound interest | 31.2% | 41.3% | 27.5% |
| Interest rates and bond prices | 27.1% | 33.3% | 39.6% |
| Probability | 36.9% | 28.3% | 34.8% |
The overall picture is less encouraging. Only 27% of respondents demonstrated high financial literacy by answering two-thirds of the questions correctly. Another 38% demonstrated moderate financial literacy, answering between 34% and 67% of the questions correctly, while a third answered fewer than 34%, demonstrating low financial literacy. In contrast, only 10% of respondents rated their own financial knowledge as poor (scores of 1-3). Half of the respondents rated their knowledge as moderate (scores of 4, 5), and 40% rated their knowledge as high (scores of 6, 7). This gap between high self-assessed knowledge and lower measured knowledge may represent a barrier to improving financial literacy.
Overall financial literacy: Objective and subjective (2015-2024, N = 107,312)
| Overall Financial Literacy | High | Medium | Low |
|---|---|---|---|
| Overall performance | 27.5% | 38.5% | 34.0% |
| Self-reported knowledge | 39.8% | 49.9% | 10.3% |
Although only about 30% of respondents reported being highly satisfied with their personal financial situation (scores of 8-10 on a ten-point scale), nearly three-quarters said they were confident in their ability to handle day-to-day financial decisions.
Fewer than one-third reported having access to financial education, and only 20% had taken a financial education class. These findings suggest that limited access to financial education may be one factor contributing to lower levels of financial literacy
Confidence and satisfaction (2015-2024, N = 107,312)
| Status | High | Medium | Low |
|---|---|---|---|
| Satisfaction with personal financial condition | 30.7% | 43.2% | 26.0% |
| Status | Yes | No | No Response |
|---|---|---|---|
| Confident in handling financial decisions | 72.5% | 23.6% | 4.0% |
Access to and participation in financial education (2015-2024, N = 107,312)
| Status | Yes | No | No Response |
|---|---|---|---|
| Had access to financial education | 29.5% | 60.0% | 10.4% |
| Participated in financial education | 20.8% | 68.7% | 10.4% |
[6] Financial Literacy in the U.S. All analyses are conducted using the 2015, 2018, 2021, and 2024 National Financial Capability Study (NFCS) surveys, administered by the FINRA Foundation.
[7] The question on probability was introduced in the 2021 survey.
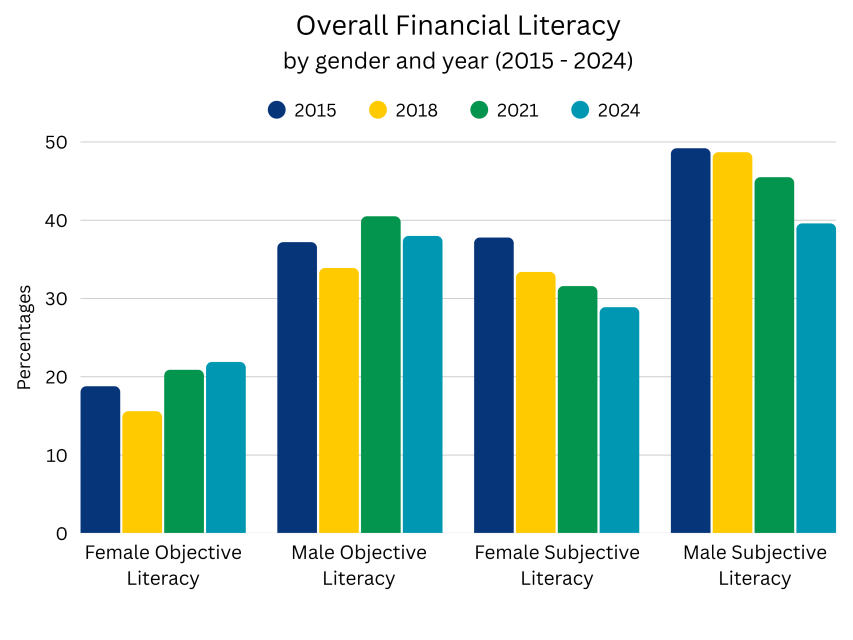
Financial literacy varies significantly by gender. Women consistently score lower than men on financial literacy measures and report lower confidence in their ability to manage financial decisions.
Across all seven questions, women were less likely than men to answer correctly. The differences ranged from about 4.5 percentage points for the mortgage duration and interest payments question to more than 18 percentage points for the diversification and risk question. Overall, financial literacy and self-reported financial knowledge were also significantly lower among women than men, with differences of 18.2% and 12.6%, respectively.
Financial literacy by gender (2015-2024, N = 107,312)
| Topic | Female (correct responses) | Male (correct responses) |
|---|---|---|
| Mortgage duration and interest | 72.1% | 76.6% *** |
| Interest rates | 69.1% | 78.7% *** |
| Inflation and purchasing power | 52.1% | 66.9% *** |
| Diversification and risk | 37.0% | 55.1% *** |
| Compound interest | 25.3% | 38.2% *** |
| Interest rates and bond prices | 21.7% | 33.5% *** |
| Probability | 32.9% | 41.4% *** |
Overall financial literacy: Objective and subjective by gender (2015-2024, N = 107,312)
| Overall Financial Literacy | Female (reporting high) | Male (reporting high) |
|---|---|---|
| Overall performance | 19.2% | 37.4% *** |
| Self-reported knowledge | 33.1% | 45.7% *** |
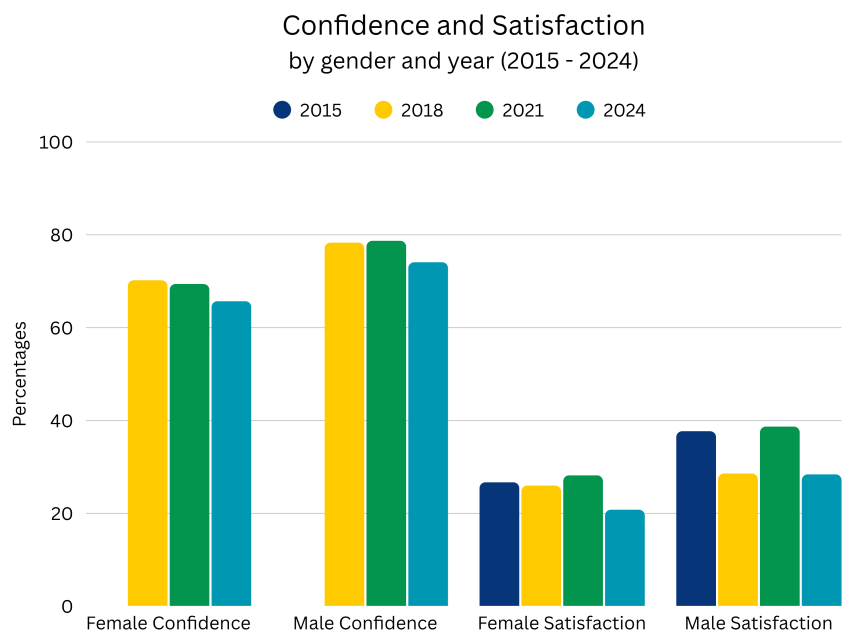
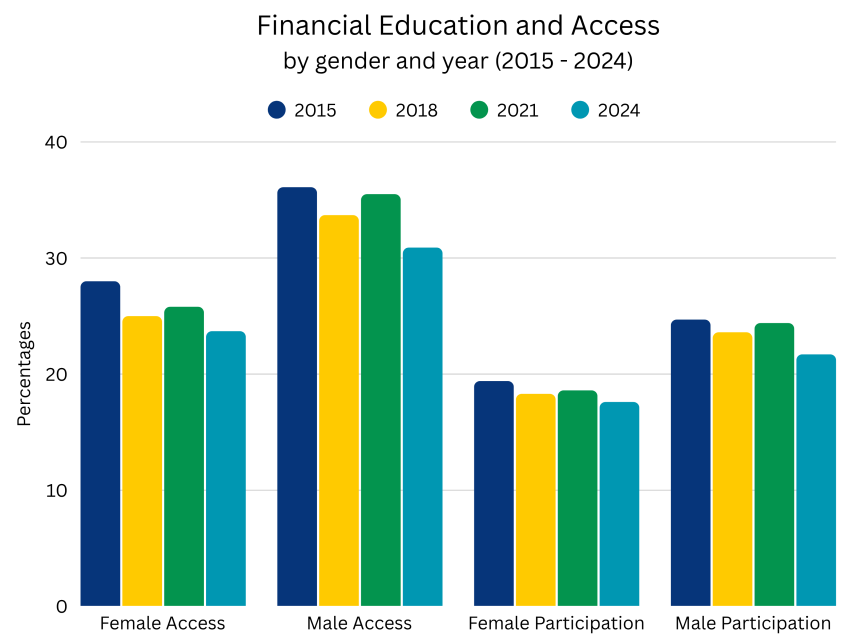
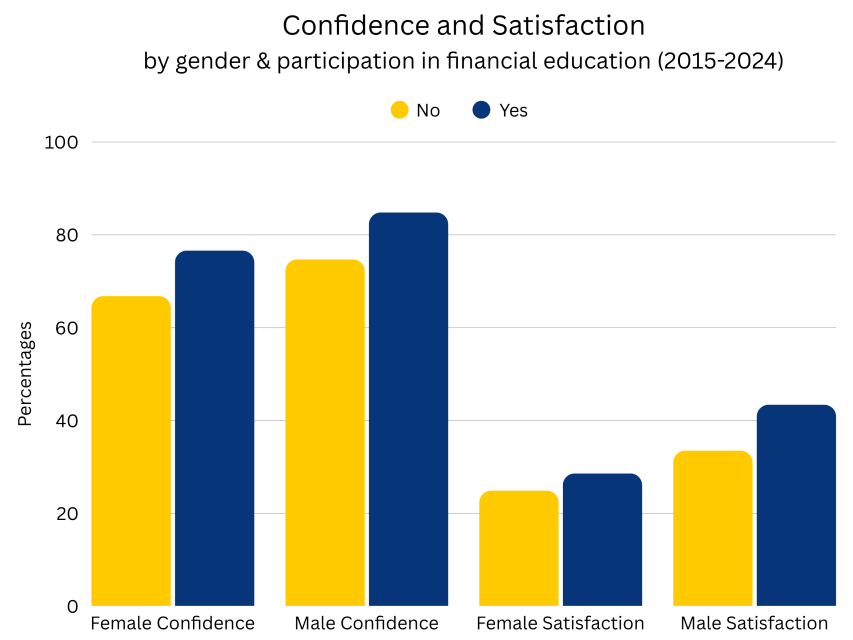
Women also reported lower satisfaction with their financial situation than men. Although nearly 69% of women said they were confident in managing financial decisions, a significantly larger share of men - about 77% - reported feeling confident. Women were also less likely to report having access to financial education and to have participated in financial education programs.
Confidence and satisfaction by gender (2015-2024, N = 107,312)
| Status | Female (reporting high) | Male (reporting high) |
|---|---|---|
| Satisfaction with personal financial condition | 25.6% | 35.9% *** |
| Status | Female (reporting yes) | Male (reporting yes) |
|---|---|---|
| Confident in handling financial decisions | 68.6% | 77.0% *** |
Access to & participation in financial education by gender (2015-2024, N = 107,312)
| Status | Female (reporting yes) | Male (reporting yes) |
|---|---|---|
| Had access to financial education | 25.6% | 34.1% *** |
| Participated in financial education | 18.5% | 23.6% *** |
***, **, and * denote statistical significance at the 1%, 5%, and 10% levels, respectively
Despite modest improvements in financial literacy over 2015-2024, the gap between men and women has remained largely unchanged.
While the gap is real and persistent, it is likely caused by less exposure to investing and financial systems, differences in education and socialization, and structural economic factors such as lower wages for women. The poorer access to financial literacy programs suggests that financial literacy programs could be specifically targeted towards women to reduce this gender gap.
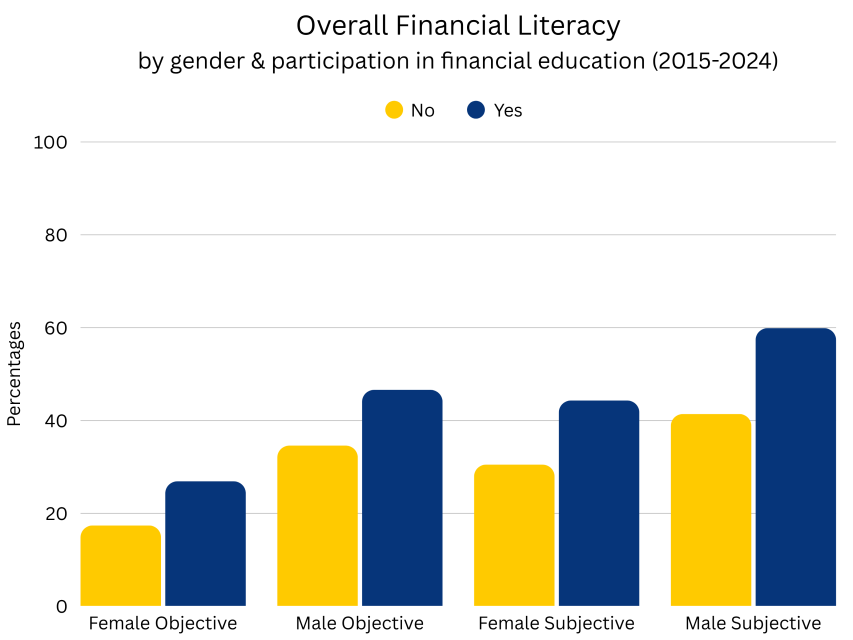
Does participating in financial education programs improve financial literacy? There is a clear correlation between participation in financial education programs and higher financial literacy, greater confidence in financial decision-making, and higher satisfaction with personal finances. The analyses reported here show associations rather than proof that financial education directly causes these outcomes.
Respondents who reported participating in financial education programs performed significantly better on financial literacy questions than those who did not. The difference in correct responses ranged from about 6% to 13% across the seven questions. Overall financial literacy and self-reported knowledge were also higher among those who had participated in financial education, with differences of 12% and 17%, respectively.
Financial literacy by participation in financial education (2015-2024, N = 107,312)
| Topic | No (correct responses) | Yes (correct responses) |
|---|---|---|
| Mortgage duration and interest | 72.7% | 79.8% *** |
| Interest rates | 72.1% | 78.6% *** |
| Inflation and purchasing power | 57.3% | 64.7% *** |
| Diversification and risk | 42.4% | 55.9% *** |
| Compound interest | 29.1% | 39.1% *** |
| Interest rates and bond prices | 25.0% | 34.8% *** |
| Probability | 35.1% | 44.0% *** |
Overall financial literacy: Objective and subjective
by participation in financial education (2015-2024, N = 107,312)
| Overall Financial Literacy | No (reporting high) | Yes (reporting high) |
|---|---|---|
| Overall performance | 25.0% | 37.1% *** |
| Self-reported knowledge | 35.3% | 52.4% *** |
Confidence and satisfaction by participation in financial education
(2015-2024, N = 107,312)
| Status | No (reporting high) | Yes (reporting high) |
|---|---|---|
| Satisfaction with personal financial condition | 28.7% | 36.3% *** |
| Status | No (reporting yes) | Yes (reporting yes) |
|---|---|---|
| Confident in handling financial decisions | 70.3% | 80.8% *** |
Participants in financial education programs were more confident in handling financial decisions (80.8% vs. 70.3%) and reported higher satisfaction with their personal finances. Financial education improves outcomes for both men and women, but the gains appear to be somewhat larger for men.
***, **, and * denote statistical significance at the 1%, 5%, and 10% levels, respectively
Compared to the rest of the U.S., North Carolina was an early adopter of public school financial education requirements, introducing personal finance content within another course in 2005. North Carolina introduced a stand-alone personal finance course requirement only recently, starting with the graduating class in 2024. But some of our neighboring states required a stand-alone course even earlier than North Carolina: Tennessee and Virginia required stand-alone personal finance courses beginning in 2011 and 2015, respectively.
North Carolina’s financial literacy levels are generally similar to those of neighboring states (Georgia, South Carolina, Tennessee, and Virginia). It is probably too early to see the results of North Carolina’s financial education requirements in the pool of adults included in the FINRA Foundation study. The first group of children participating in the stand-alone course will have only just graduated from high school.
Compared to our neighboring states, North Carolinians perform as well on four out of the seven questions. The proportion of correct responses is lower than that of our neighbors in three questions; however, the differences are small (around 2%-3%). There is no significant difference in overall performance and self-reported knowledge.
The differences are larger when compared to the country’s averages. North Carolinians fall behind the national proportions on five out of the seven questions, with the proportion of correct responses lower by between 3% to 6%. Overall, North Carolinians report lower literacy levels than the nation. But there is no difference in self-reported knowledge.
Financial literacy by state (2015-2024, N = 107,312)
| Topic | NC (correct response) | Neighbors (correct response) | USA (correct response) |
|---|---|---|---|
| Mortgage duration and interest | 69.5% | 72.1% ** | 74.2% *** |
| Interest rates | 70.6% | 70.3% | 73.5% *** |
| Inflation and purchasing power | 54.4% | 55.1% | 58.9% *** |
| Diversification and risk | 39.6% | 42.2% ** | 45.2% *** |
| Compound interest | 27.6% | 29.7% * | 31.2% *** |
| Interest rates and bond prices | 26.4% | 27.0% | 27.1% |
| Probability | 34.9% | 34.6% | 36.9% |
Financial literacy by state (2015-2024, N = 107,312)
| Status | NC (reporting high) | Neighbors (reporting high) | USA (reporting high) |
|---|---|---|---|
| Overall performance | 23.5% | 24.6% | 27.5% *** |
| Self-reported knowledge | 39.4% | 40.5% | 39.8% |
Residents of North Carolina and neighboring states reported similar levels of confidence in handling financial decisions. However, North Carolina residents were somewhat less satisfied with their personal financial situations. North Carolina also fares worse than neighboring states in reported access to financial education (27.7% compared with 30.3%), although the proportion of residents who participated in financial education programs was similar. A similar pattern appears when comparing North Carolina with national estimates.
Confidence and satisfaction by state (2015-2024, N = 107,312)
| Status | NC (reporting high) | Neighbors (reporting high) | USA (reporting high) |
|---|---|---|---|
| Satisfaction with personal financial condition | 28.4% | 31.7% *** | 30.7% ** |
| Status | NC (reporting yes) | Neighbors (reporting yes) | USA (reporting yes) |
|---|---|---|---|
| Confident in handling financial decisions | 72.4% | 72.6% | 72.5% |
Access to and participation in financial education by state (2015-2024, N = 107,312)
| Status | NC (reporting yes) | Neighbors (reporting yes) | USA (reporting yes) |
|---|---|---|---|
| Had access to financial education | 27.7% | 30.3% ** | 29.5% * |
| Participated in financial education | 20.3% | 21.1% | 20.8% |
Trends over 2015-2024
(detailed results are available from the FLC upon request)
While financial literacy has improved modestly in neighboring states, progress in North Carolina has remained largely stagnant over the past decade.
***, **, and * denote statistical significance at the 1%, 5%, and 10% levels, respectively
[8] Data from www.carlyurban.com
Financial literacy remains a significant challenge in both North Carolina and the United States. While many individuals express confidence in managing their finances, objective measures show that a large share of respondents struggle with key financial concepts such as risk diversification, compound interest, and the relationship between interest rates and bond prices.
Financial education is associated with meaningful improvements in financial literacy and financial confidence. Individuals who participate in financial education programs tend to perform better on financial literacy questions and report greater confidence in handling financial decisions. However, many respondents lack access to financial education.
Gender differences in financial literacy remain substantial and persistent. Women consistently score lower than men on financial literacy measures and report lower confidence in financial decision-making. These differences have shown little improvement over time.
Compared with neighboring states, North Carolina performs similarly on several measures but underperforms compared to the national average on several indicators of financial literacy. Trends over the past decade also suggest that financial literacy has improved more slowly in North Carolina than in nearby states.
Taken together, these findings suggest that expanding access to effective financial education - while also addressing persistent gaps across demographic groups - could play an important role in strengthening financial literacy, improving financial wellbeing, and building greater financial resilience across North Carolina.
This page was last modified on 06/19/2026